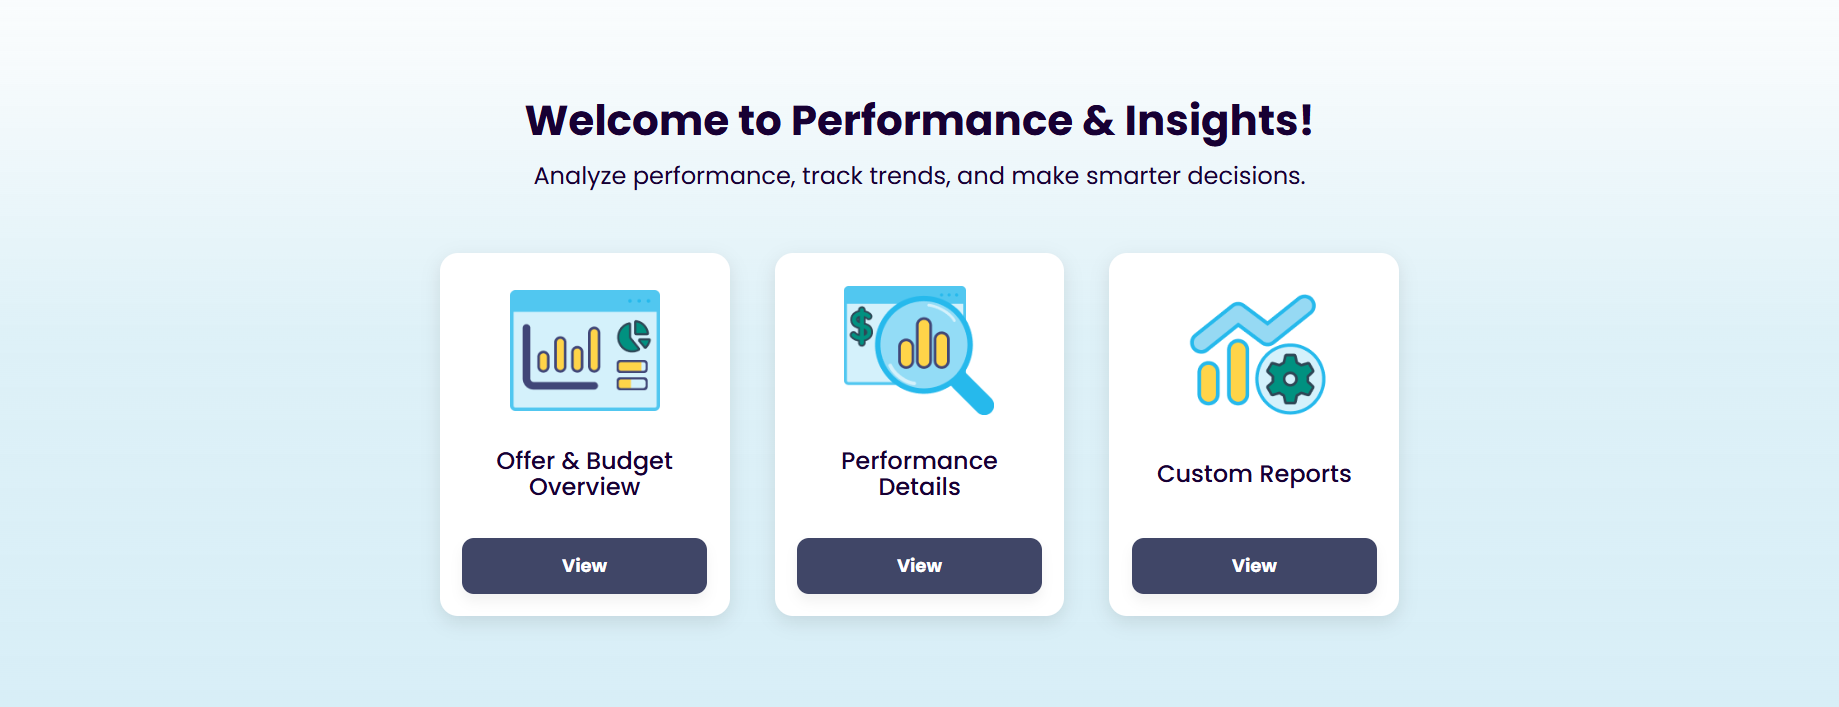
After signing in, you'll land on your P&I home page. You'll see tiles to guide you to the right report view based on what you're looking to achieve.
The Offer Overview section includes report views of all of your in-market offers aggregated. Use this view to take a look at campaign activation by location or calendar, or track your redemption or production costs for budgeting purposes.
The Performance Details section provides report views of your campaign redemption performance, with visual trackers to narrow in on redemptions by offer type.
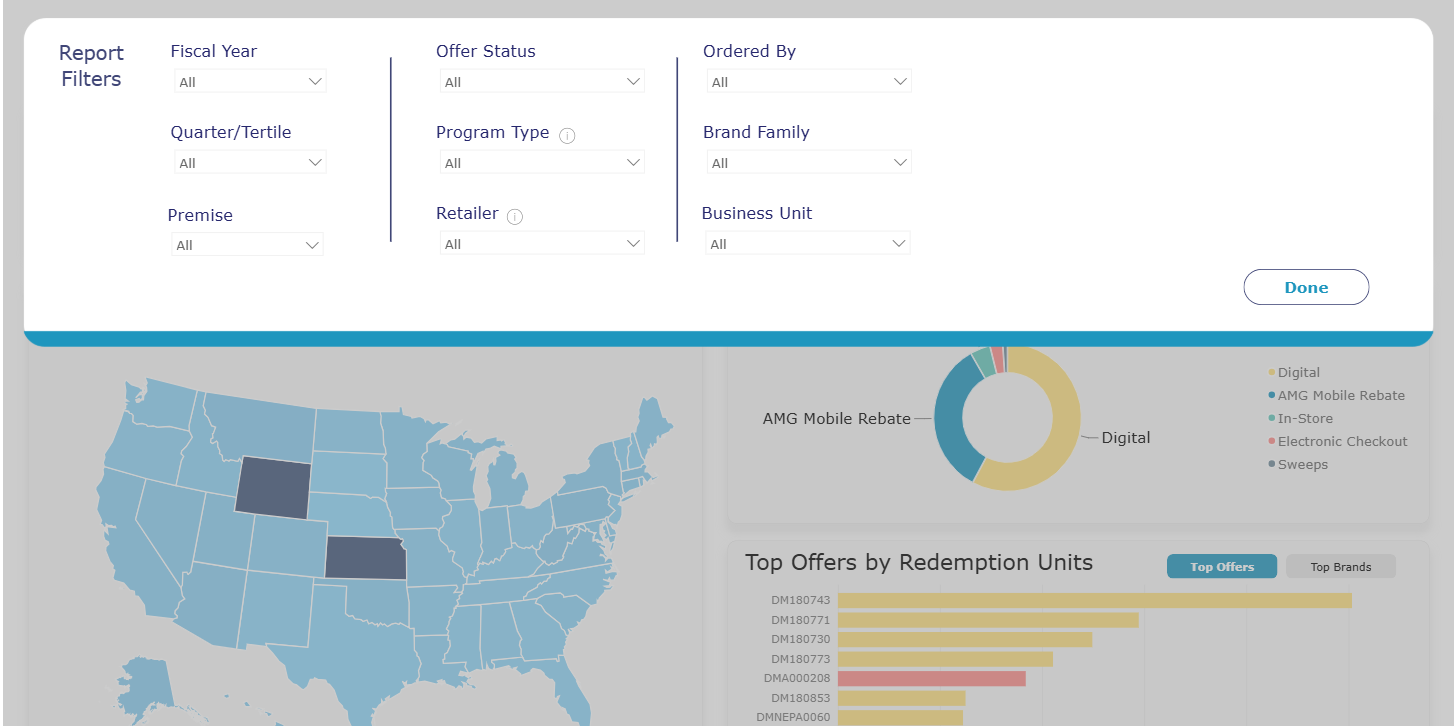
 Using filters
Most reports can be filtered by date, brand, retailer, market, program type, and offer type. Open your filters modal by clicking the filter bar at the top left corner of your report; clear all filters by clicking the (X) on the closed modal bar.
Drill-through capability
Drill-throughs help you navigate to more granular data, or narrow in on one single selected datapoint from a larger data set.
1. Right-click a chart element or data point
2. Select Drill Through
3. Choose the visual report in which to view the selected data point 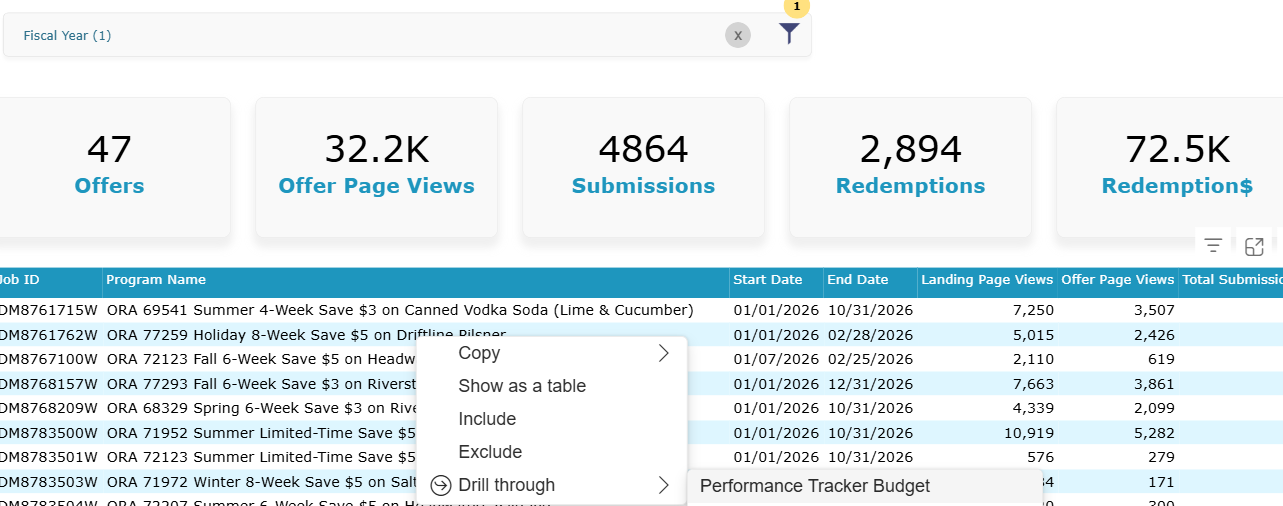
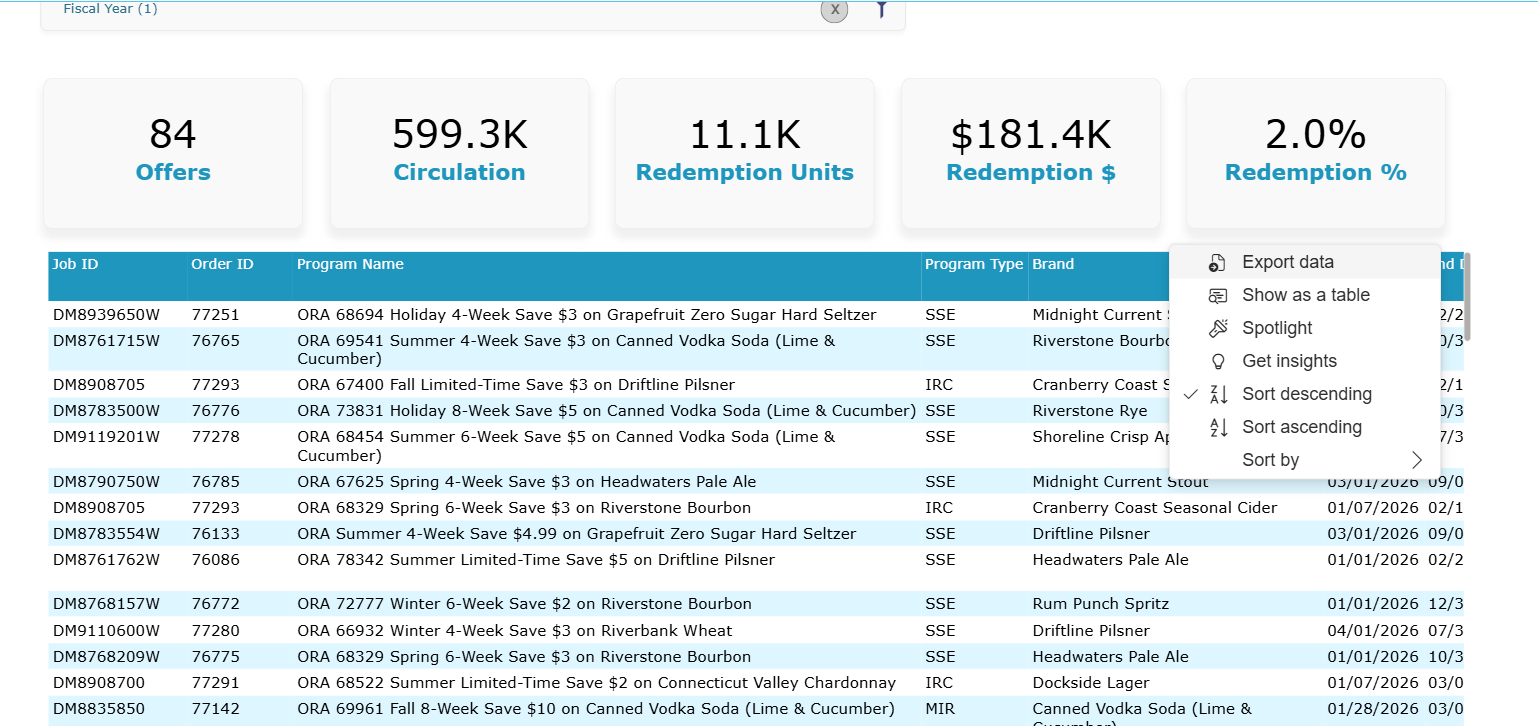
Exporting data
All table reports and some visuals can be exported to a CSV or .Xls file to be reconciled elsewhere or used in your own internal workflows.
1. Select the More Options (...) menu
2. Choose Export Data, and select your format
3. Download the file for further analysis, reconciliation, or to add more internal context.
Was this article helpful?
That’s Great!
Thank you for your feedback
Sorry! We couldn't be helpful
Thank you for your feedback
Feedback sent
We appreciate your effort and will try to fix the article